Field Notes from 2026-04-29. Three layers. Eighteen years. One question we ask every morning: what's about to break that nobody's noticed yet?
There are two ways to find out your server is struggling. The first is when a client calls to say their website is slow. The second is when your monitoring dashboard lights up at 2 AM and you fix the problem before anyone wakes up. We strongly prefer the second way.
At WebOps Hosting, we have invested in a monitoring infrastructure that most hosting companies at our scale would consider overkill. Every server in our fleet, spread across data centers in New York, Chicago, and Amsterdam, is instrumented with infrastructure agents feeding real-time telemetry into dashboards we check daily. Combined with NodePing uptime monitoring across every site we manage, the result is a layered WordPress monitoring system that catches problems early and often.
This post explains what we monitor, how we monitor it, and why it matters for your business.
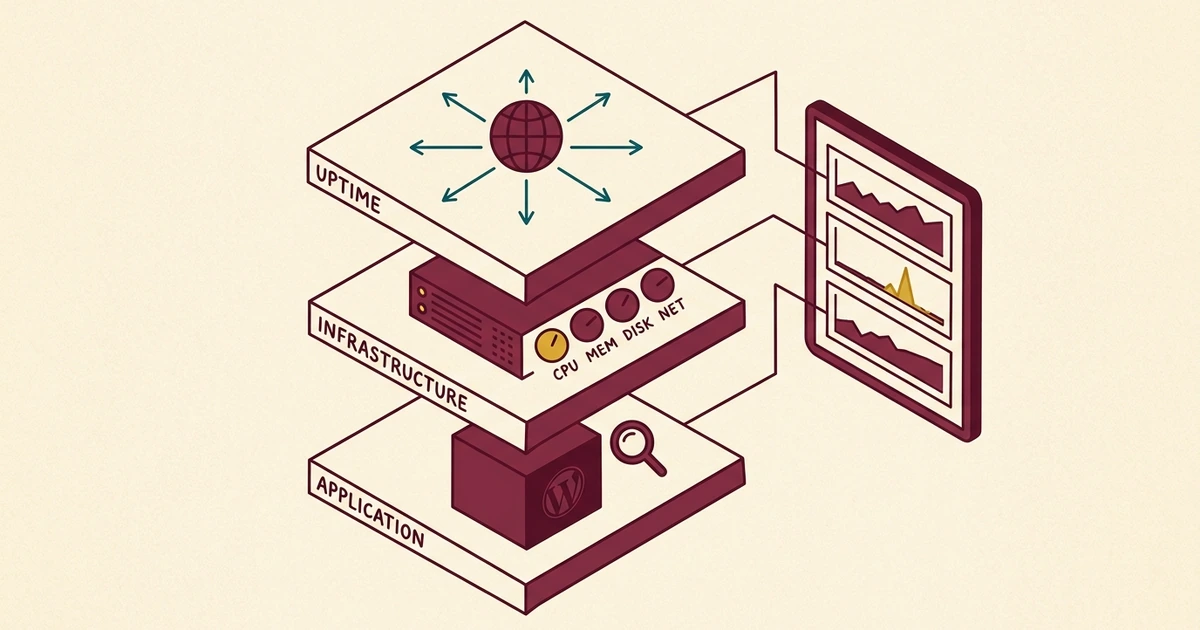
Three layers, three different questions
Most people think of monitoring as a simple question: is my website up or down? That is an important question, but it is only one layer of a much more comprehensive picture. We think about monitoring in three distinct layers, each answering a different question.
Layer 1: Uptime monitoring. Is it up?
This is the most basic layer, and it is where most hosting companies stop. Uptime monitoring checks whether your website responds to HTTP requests. If it does not, an alert fires.
We run NodePing checks against every site in our fleet, verifying not just that each site returns an HTTP 200 status code, but that the response body contains expected content. A server that returns a blank page or an error message still technically responds to an HTTP request. Our checks are smart enough to catch that distinction.
But uptime monitoring has a fundamental limitation: it tells you about the present, not the future. Your site can be up while the server's disk is 94% full, memory is being consumed by a runaway process, or CPU load is climbing steadily toward a tipping point. By the time uptime monitoring catches the problem, your visitors have already experienced it.
Layer 2: Infrastructure monitoring. How is it performing?
This is where infrastructure-level telemetry comes in, and where we diverge from what most small-to-midsize hosting operations do.
Agents run on every server in our fleet, collecting metrics on CPU utilization, memory usage, disk I/O, network throughput, and system load averages at regular intervals. This data flows into a centralized dashboard where we can see the health of our entire fleet at a glance.
The difference between uptime monitoring and infrastructure monitoring is the difference between checking whether your car starts and monitoring the oil pressure, coolant temperature, and tire pressure while you drive. The car might start fine today, but if you are burning oil, you want to know about it before the engine seizes.
Here is what we track across the fleet:
- CPU utilization. Sustained spikes can indicate a runaway process, a brute-force attack, or a poorly optimized plugin.
- Memory usage. Memory leaks and resource-hungry processes get caught before they trigger the Linux OOM killer.
- Disk usage. Log file growth, backup accumulation, and media upload trends are visible weeks before they become a problem.
- System uptime. We know exactly how long each server has been running since its last reboot, which helps us plan maintenance windows.
- Network I/O. Unusual traffic patterns can indicate a DDoS attack, a bot crawling aggressively, or a CDN misconfiguration.
Layer 3: Application monitoring. Is WordPress healthy?
The third layer looks at the application itself. A server can have plenty of CPU and memory available, but if a WordPress plugin is making 200 database queries per page load, your visitors are still going to have a slow experience.
We monitor application-level health through a combination of tools: response time checks, error log analysis, and the data we collect through our monthly Website Health Pro Reports. When we see a site's response time creeping upward, we dig into the cause before it becomes a performance complaint.
The morning check
We are not just consumers of off-the-shelf monitoring tools. We have built custom tooling on top of industry-standard platforms to make fleet-wide monitoring practical.
Our morning check is a single command, not a sequence of dashboard tabs. Fleet-wide health snapshots take about ninety seconds because we built tooling to make that the default, not the exception. Instead of logging into separate dashboards or clicking through a web interface, we run one command and get a complete picture of every server in the fleet.
A typical morning check looks something like this: we pull CPU and memory metrics for every server, check for any disk usage anomalies, and review system uptimes. The whole process is finished before we have even finished our coffee.
This is not theoretical. When we documented how we protect our WordPress sites from bot attacks, the story started with our monitoring infrastructure. We saw a server load spike within minutes of it beginning, identified the cause (a distributed bot attack), and deployed countermeasures before any client noticed degraded performance. The full play-by-play is in the when the bots come back follow-up. That sequence of events is only possible when you have real-time infrastructure visibility.
From reactive to proactive
The shift from reactive to proactive hosting is not just a marketing phrase. It represents a fundamentally different operational model.
In a reactive hosting environment, the workflow looks like this:
- A client notices their site is slow or down.
- The client contacts support.
- The support team begins investigating.
- The root cause is identified (eventually).
- A fix is implemented.
- The client is notified.
The problem with this model is obvious: by the time step one happens, your visitors have already had a bad experience. A potential customer who encounters a slow or broken website is not going to wait patiently while you debug it. They are going to go to your competitor.
Our workflow looks different:
- Monitoring detects an anomaly: rising CPU, increasing memory pressure, or unusual traffic patterns.
- We investigate the cause before it impacts performance.
- We implement a fix or mitigation.
- The client never notices because there was nothing to notice.
This is less dramatic. There is no urgent phone call, no "the website is down" panic. Just quiet, competent infrastructure management. Honestly, that is the way hosting should be: boring for the client because everything just works.
What it looks like in practice
Let us walk through a real scenario to make this concrete.
One of our busier servers hosts several dozen WordPress installations. During a routine morning check, we noticed CPU utilization had climbed from its usual baseline of around 15% to a sustained 45%. Memory usage was also trending upward, though not yet critical.
We dug deeper. The spike correlated with a burst of POST requests hitting multiple sites on the server, classic bot behavior attempting to probe contact forms and login pages. Without infrastructure monitoring, this spike would have continued until it either triggered an uptime alert (site down) or a client called to complain about slow page loads.
Instead, we identified the attacking IP ranges, updated our bot protection rules at the .htaccess level so the requests never even reached PHP, and watched the CPU drop back to baseline within minutes. Total client impact: zero.
That is what proactive WordPress monitoring buys you. Not a faster response to problems. No response needed at all because the problem was prevented.
NodePing: the safety net
Our infrastructure agents tell us how our servers are performing from the inside. NodePing tells us how they look from the outside.
We maintain uptime and content checks for every site in our fleet, testing at regular intervals from external locations. These are not simple ping tests. They are full HTTP content checks that verify the site is not only responding but serving the expected content.
We also run SSL certificate monitoring to catch expiration issues before they happen. An expired SSL certificate does not just show a browser warning. It can cause email delivery failures, API integration breakdowns, and a complete loss of visitor trust. Our monitoring catches certificates approaching expiration weeks in advance.
The internal and external layers serve complementary purposes. Internal telemetry can tell us that a server's CPU is at 10% and everything looks healthy from the inside, but if a network routing issue is preventing traffic from reaching the server, only external monitoring will catch that. Conversely, NodePing might report that a site is responding normally, but our internal metrics can reveal that it is using 90% of available memory to do so. That is one traffic spike away from becoming a real problem.
Why most hosting companies do not do this
If proactive monitoring is so valuable, why do most hosting companies not provide it?
The honest answer is that monitoring at this level requires investment. Not just in tools, but in the expertise to interpret the data and the discipline to check it consistently. Installing monitoring agents is relatively straightforward. Building custom tooling that surfaces fleet-wide health quickly, and establishing a daily review process that catches anomalies before they become incidents. That is where the real work happens.
Most shared hosting providers manage thousands of accounts per server. They are optimized for density and price, not for visibility into individual site performance. They will restart Apache if it crashes and call that "monitoring." That is not the same thing.
We run a managed fleet where we know every site personally. We can notice when one site's behavior changes, and we have the infrastructure headroom to investigate and respond without impacting other clients. That is a fundamentally different relationship between a host and its clients.
It is the same operating model that surfaced the six WordPress sites silently running without their object cache: we want to know about silent failures before our clients do. The same fleet visibility lets us run spam intelligence at fleet scale, so the entire stack (servers, applications, forms) is observable and accountable.
What this means for you
As a WebOps client, you benefit from this monitoring infrastructure without having to think about it. You do not need to install monitoring plugins, set up alert thresholds, or learn to read server metrics dashboards. That is our job.
Monitoring isn't a feature we sell. It's the operating posture that makes everything else possible. You don't have to ask us how your site is doing. We're already looking, and if something needs attention, we're already on it.
What you get is hosting that works reliably, issues that get resolved before you notice them, and a team that can answer specific questions about your server's performance when you ask. If you want to know how much CPU your site uses, what your average response time is, or whether your traffic has been increasing, we can tell you, backed by real data, because we are already collecting it.
This is part of what we mean when we say we operate as your in-house webmaster. We are not just renting you space on a server. We are actively managing the infrastructure your business runs on, with 18 years of experience and the custom tooling to do it well.
Is this you?
If you run WordPress somewhere other than WebOps, three quick checks will tell you whether your hosting setup is monitored in any meaningful way.
- Has your hosting provider ever told you a server-level metric without you asking? CPU utilization, memory headroom, sustained load average. If the only number you ever see from them is "uptime: 99.9%", they're checking one layer of three. The other two only get inspected when something breaks.
- If your site's CPU climbed from 15% to 45% over a Tuesday morning, would anyone notice? Without infrastructure monitoring, the spike runs until it either pushes the site over the edge into a 5xx outage or a customer calls to complain. Either way, the bad experience already happened.
- Does your monitoring distinguish between "the site responds" and "the site responds with the right content"? A blank page returns HTTP 200. A WordPress white screen of death returns 200. A hacked site serving spam returns 200. Uptime checks that don't validate response body miss every one of these.
If those answers made you uncomfortable, the fix isn't more dashboards. It's a hosting setup where someone is paid to read the dashboards every morning and act on what they see.
Get in touch if you want to talk about WordPress monitoring, fleet visibility, or what proactive hosting actually looks like in practice. We've been managing WordPress infrastructure for 18 years. Take a look at our managed WordPress hosting plans to see what's included.

No comments yet. Be the first to comment!
Leave a Comment