Field Notes from 2026-05-03. Two stale backups in the first thirty minutes. One false alarm that accidentally validated the page path. The cleanup gap we didn’t see coming.
Two days ago we said the next chapter of the observability platform was alerting, and that we’d wait thirty days for baselines before turning anything on. We ended up turning a chunk of it on inside 48 hours, and the first half hour after we did, three notifications hit. Two were emails about real stale backups: one site fifteen days behind, another four. The third was a Pushover priority-1 page at full volume — false alarm, cron timing bug — that proved the wake-me-up path actually pages. All three were the system working as designed, in opposite directions.
This is the writeup of what shipped, what didn’t, what we got wrong, and the architectural gap the real findings surfaced.
Defer the anomaly tier; ship the hard-fail tier now
The previous post said we’d run the platform for thirty days before wiring alerts. That reasoning was correct for one class of alert and overcorrected for another.
Anomaly alerts — traffic spikes, revenue drops, “this Plesk subscription is using more CPU than its baseline” — do need real seasonal data. Without three or four weeks of weekday-vs-weekend, time-of-day, end-of-month patterns, every threshold is a guess and most fire false positives. Those stayed deferred. We’ll come back to them later in May.
Binary alerts — is X broken right now, yes or no — don’t need baselines. They need a query and a threshold and a notification channel. “The most recent backup for this site is more than 36 hours old” doesn’t get more or less true based on what time of day the question was asked. So we shipped that tier alone, two days into the thirty.
Two-tier routing, not five
Two channels. Pushover priority-1 (full-volume, override-do-not-disturb) for the wake-me-up class: Postgres down, every ETL silent simultaneously, multi-site backup failure, IAWP poller daemon down, the metrics host itself unreachable. Email for the look-at-this-tomorrow class: a single site’s backup missed, mail queue elevated on one server, an RBL listing, a DMARC pass-rate drop on a domain that was previously passing, an individual ETL silent.
Two priorities, not five. No graduated escalation, no “page if no ack within fifteen minutes” laddering. Either it’s the kind of thing that should pull us out of bed, or it isn’t. The Grafana notification policy is one rule on severity=critical: critical goes to Pushover with repeat: 1h, everything else falls through to email with repeat: 4h, grouped by [alertname, host] so a single backup-engine outage produces one page, not ten. The whole config lives in wire-alert-rules.py, same idempotent re-run pattern as last post’s dashboard wirings — source of truth in git, not the UI.
Don’t let alerts depend on the thing you’re alerting about
The first thing we caught and undid was the most embarrassing kind of mistake. Grafana was set to relay its email through the fleet’s own Postfix — the same Postfix we wanted alerts about. If a fleet mail server went down, alerts about that outage would queue silently inside the very thing that was broken. We’d find out by client ticket, exactly the failure mode we said we were getting away from.
Wired Grafana SMTP to AWS SES instead — already in our stack for fleet transactional email, completely independent of any host’s Postfix. NodePing follows the same rule: its Pushover and email paths run through infrastructure unrelated to the thing being watched. An alert that depends on the working of the thing it’s alerting about is not an alert. It’s a hope.
Meta-monitoring the alerter
The next problem: Grafana itself can fail silently. Postgres can lock up. The metrics box can OOM. The cron that drives the data flow can stop. If Grafana stops sending alerts because Grafana is down, the absence of alerts looks identical to the absence of problems.
The fix is a heartbeat. A NodePing PUSH check expects a tick from the metrics host on a tight interval. A one-line cron on the metrics box calls Grafana’s /api/health locally and only forwards the heartbeat if Grafana responds healthy. If Grafana hangs, no heartbeat. If the box is down, no cron. NodePing notices the silence and pages via Pushover priority-1, over a path with zero dependency on Grafana.
We learned this works on day one, the hard way. The first cron interval was */3 — every three minutes. NodePing’s eval window was five. The very first heartbeat arrived after NodePing had already declared the check down, which paged us at full volume on a Saturday morning. The fix took two seconds: tighten the cron to every minute. The accidental upside: end-to-end proof that the page path works. Pushover delivered, the phone overrode do-not-disturb, the check recovered, NodePing logged the recovery. Best false alarm we’ve ever had.
First-day findings
The two stale-backup emails that arrived inside the first half hour were both correct.
The first: 15 days behind. The site had been removed from the fleet entirely two weeks earlier. The S3 prefix it backed up to was no longer being written.
The second: 4 days behind. The site had been migrated from one fleet server to another four days prior, and the old prefix on the source server was still being walked by our backup-status ETL even though no new backups would ever land in it again.
The alerts were right. Both sites had stopped backing up at the prefixes the ETL was watching. What surprised us was that both alerts were also kind of wrong — the underlying sites were fine, the live backups elsewhere were current. The backups they were complaining about were ghosts. Neither client was actually unprotected. The alerts didn’t know that.
The cleanup gap
This is the part we didn’t see coming, and it’s the most interesting thing the build taught us.
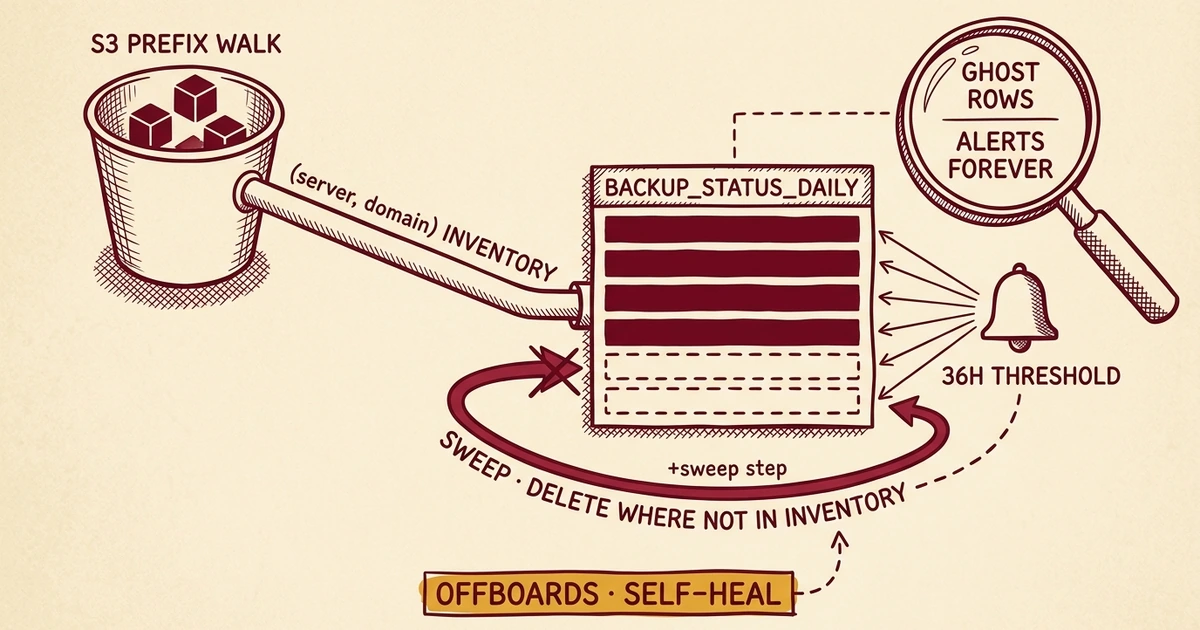
Our backup ETL discovers sites by walking S3 prefixes under each fleet server’s bucket. Every site found becomes a row in backup_status_daily with a last-seen timestamp. The ETL has only ever inserted and updated. It has never deleted.
So every offboarded or migrated site leaves a row behind, and that row’s timestamp ages past the 36-hour threshold and stays there forever. The alert was working perfectly. It was just firing on sites we’d already cleaned up. Without a sweep, the only way to silence it is hand-cleaning rows in Postgres after every offboard — a contract that dies the first time someone forgets, which is week two.
Fixed in etl-backups.py as a sweep_wptk() step at the end of every run. The in-flight S3 walk’s (server, domain) set is the inventory; any row in backup_status_daily whose scope no longer appears gets deleted. The sweep refuses to run if discovery returned zero, which prevents a bad S3 list from truncating the table.
The offboarding skill and the onboarding-migration skill have both been updated to reflect the new contract. “Delete the rolling-backup S3 prefix” is now the entire database step. The metrics layer cleans up after itself.
What shipped vs. what was teased
The previous post listed five alerting candidates in rough wiring order. Here’s the reality, two days later.
Backup older than 36 hours, any site. Live, email tier. Found two ghost rows within thirty minutes — one offboarded site, one inter-server migration — which surfaced the cleanup gap above.
DMARC pass-rate drop. Live, modified. Original: “drops by more than ten points week-over-week.” Real version: yesterday’s rate against the previous seven-day baseline, fires only on domains that were passing (above 95%) over that baseline. Without that filter, we’d page on the long tail of domains we already know are stuck at zero.
Mail bounce rate / queue elevated. Live, split into two rules. Bounce-rate spike per server is one; sustained queue depth above a fixed threshold is another. Sustained-for-an-hour was too narrow as a single rule.
Plesk subscription over 50% CPU or 800 MB sustained. Deferred. The rule that most needs baselines — what counts as “sustained” varies wildly by site type and time of day. Revisit with three weeks of cgroup data.
Redis hit rate below 70% on traffic above ten visits per hour. Deferred. Hit-rate baselines are bimodal by content type and time of day; not enough data yet to set the floor without firing constantly.
Three of five shipped, two parked behind real data. About right for the confidence we have today.
Closing
The platform now tells us when something is broken, and it doesn’t tell us about things we’ve already cleaned up. Both halves matter. A noisy alerter gets ignored as fast as a missing one.
The anomaly tier — “this site looks weird compared to its own usual” rather than “this site is on fire” — comes next, after the seasonal data is in. For now, in roughly thirty hours, we crossed from “we’d find out from a client ticket” to “we get paged before the client notices, with one false alarm earned by validating the page path on day one.”
An alert is a contract. It only works when the alerter is independent of the thing it watches, when it watches itself, and when its data layer prunes what no longer exists. Get any one of those wrong and you have noise, not coverage.
Every alert above feeds the same substrate behind our monthly Website Health reports and the per-domain email visibility we already publish to clients. Alerting just makes that substrate self-monitoring instead of dashboard-only.
Get in touch if you want to talk about WordPress hosting that operates at this level. Eighteen years of doing this; see our managed WordPress hosting plans for what’s included.

No comments yet. Be the first to comment!
Leave a Comment